Investing in the Dominican Republic

Source: Canadian Real Estate Magazine

Colleen Valerio, head of sales and marketing for DR Properties, explains why Canadian investors should consider investing in the Dominican Republic.

Q: Why is the Dominican Republic a great place to invest right now?

A: It’s not just about investments for our clients. It’s mostly people who want to get into a future retirement place that’s out of the cold. They choose the Dominican Republic because we have a stable government, a large Canadian community, great infrastructure, and lots of good services. The other reason they choose this area is because we have a big tourist market.

Q: What has attracted Canadian investors to the Dominican Republic?

A: On the investment side, certainly rental returns. Most developments usually average a 70 per cent occupancy rate over the course of a year. So for our clients, who are still working, they’re living in these properties for two weeks to a couple of months a year, and the rest of the time, they’re watching it earn some money.

Q: What are the average property prices and rents in the Dominican Republic?

A: You can spend anywhere from $70,000 up to $10 million. Our buyers tend to be on the $200,000 to $400,000 range, and that will get you a very nice house in a gated subdivision. For rentals, most people rent on a short-term or nightly basis to vacationers. The rates range from $100 to $400 per night, depending on the location, type and size of property.

Q: What types of properties are the best buys?

A: Most of our buyers have been choosing single-family homes lately because they can get a good bang for their buck, and they have great rental returns. In terms of condos, anything on the oceanfront attracts attention. If you can get it for a good price and it’s well-managed, that’s a great return and capital appreciation.

Q: What are some the best areas for investing in the Dominican Republic?

A: We tend to focus on the Cabarete area for a few reasons: there is a great community there and infrastructure that supports real life. If you’re looking for investments, a lot of people will look at Punta Cana, but there is no infrastructure there.

Q: How has the country performed amongst baby boomers and retirees?

A: Our average buyer is between 45 and 65. Most people want to use the property themselves, as well as have it as an investment.

Economic outlook
The Dominican Republic is economically sound. According to the IMF, its GDP is expected to jump sharply, from 2.2 per cent in 2013 to another 3.4 per cent in 2014.

This article was first published in the October 2013 issue of CREW magazine.

Travel to Dominican up 7.5% in January

Source: DR1 Travel News

Despite a series of snowstorms that have caused travel plan cancellations, travel to the Dominican Republic continues to grow. The Central Bank of the Dominican Republic reports that 33,833 more non-resident travelers entered the country in January 2015 compared to January 2014. Of this total 23,376 were foreigners (up 6.2%), while 8,457 were Dominican expats, or 22% more.
The Central Bank says that 96.5% of the travelers visited for recreation, 1.7% to see friends and family and 1.2% for business. 95.5% of them stayed at hotels. 57.2% were in the 21-49 age bracket, with an almost equal split of 50.5% female and 49.5% male visitors.
The Central Bank says that the average 10% growth the country has experienced over the past 16 months is explained by the recovery in the US market, the main source for travel to the Dominican Republic. Tourists from the United States prefer traveling to the Dominican Republic in the Caribbean.
Total number of arrivals at the eight international airports was 536,234 visitors, including Dominicans and foreigners.
Tourist arrivals were mainly from the United States, Canada and Mexico (57%), followed by Europe (27.6%) and South America (12.8%).
In January, 20,682 more travelers arrived from the United States. There were also increases from Brazil (4,777 more), Venezuela (3,448), Germany (3,280), UK (3,054), Spain (2,532), Colombia (1,518), Sweden (1,130), Chile (904), France (860) and Italy (858).
Only travel from Russia was down by 0.9%. There were 12,226 fewer Russian travelers in January, reflecting the recent downturn of the Russian economy.
This was compensated by increases in visitors from Germany (15.4%), UK (39.2%), Spain (27.8%), France (3%), Italy (8.9%) and Sweden (34.9%).

Caribbean sets new tourism record

Source: Edmonton Journal, Business section, February 11, 2015

San Juan, Puerto Rico

Officials say a record 26.3 million people travelled to the Caribbean last year and spent an unprecedented amount of money in what is considered the world’s most tourism-dependent region.

It is the fifth consecutive year that the Caribbean reports an increase in tourists following an economic crisis that forced resorts to shut down and caused a drop in visitors and spending. The Caribbean Tourism Organization on Tuesday attributed the increase in part to improvements in airports, the opening of new hotel chains and an increase in direct flights and airline seat capacity.

The Dominican Republic, Cuba, Jamaica and Aruba are among the larger destinations that saw an individual record number of visitors.

Tourists overall spent more than $29 billion US in the region last year.


Are you ready to put Don’s 35 years of business and sales experience to work for you? Simply click on the appropriate red button below:

Sellers start here button1 Buyers start here button1

Pro Cigar 2015 in Dominican Republic

Source: DR1 Travel News, Pro Cigar

A great opportunity to get an insider view of the best of the Dominican cigar industry, during the Pro Cigar Festival 2015 local cigar manufacturers once again open their doors to tourists from around the world. This year’s event takes place from 15-20 February with trips to the Tabacalera de Garcia installations in La Romana and also to General Cigar, Davidoff, Quesada Cigars, La Aurora, Corporacion Cigar Export, Tabacalera La Alianza-EP Carrillo, La Flor Dominicana, Tabacalera Palma and the Cigar Family Charitable Foundation.
Gala dinners ending with the best premium smokes are planned for the evenings. The event promises to be both a learning experience and a treat for cigar smokers.


Are you ready to put Don’s 35 years of business and sales experience to work for you? Simply click on the appropriate red button below:

Sellers start here button1 Buyers start here button1

February is Carnival Time in Dominican Republic

Source: DR1 Travel News

Every Sunday in February is time for carnival. The most famous Dominican carnival celebrations take place in La Vega (with the traditional diablo cojuelo characters), Bonao (macaraos), and Santiago (lechones). In Puerto Plata there is also a carnival at the Central Park where the traditional carnival character is the “taimascaro.”
The National Carnival Parade then takes place in Santo Domingo on Sunday, 1 March 2015 and on 7 March 2015 in Punta Cana. In both locations a selection of the best carnival troupes from all over the country will be taking part.


Are you ready to put Don’s 35 years of business and sales experience to work for you? Simply click on the appropriate red button below:

Sellers start here button1 Buyers start here button1

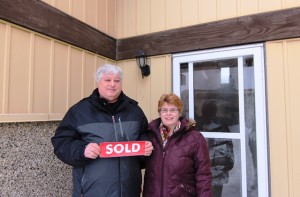
Testimonial – 14616 118 Street

Testimonial - 14616 118 Street

“Given the recent retrograde activity in the Alberta economy and the extremely slow period of time in which we had to list, we feel fortunate indeed to have exacted a fair price on the unit in which we live.  Don was recommended to us from a personal friend of my sister. We are pleased that his expertise helped us negotiate the curves of this stressful moment in time.” – Larry & Marilyn


Are you ready to put Don’s 35 years of business and sales experience to work for you? Simply click on the appropriate red button below:

Sellers start here button1 Buyers start here button1

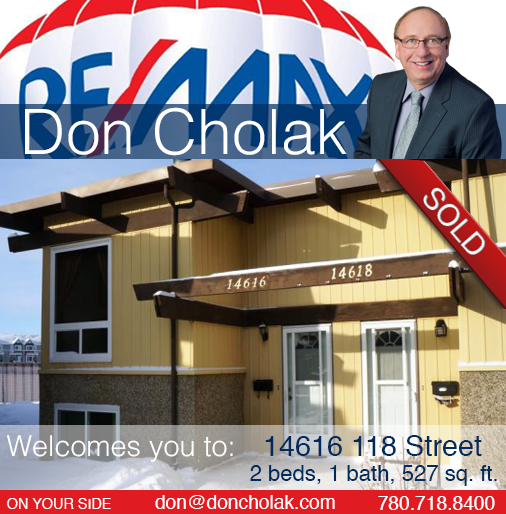
14616 118 Street : Edmonton : $189,900 : Sold

 Thank-you! It was a pleasure helping you sell your home!


Thank-you! It was a pleasure helping you sell your home!

Are you ready to put Don’s 35 years of business and sales experience to work for you? Simply click on the appropriate red button below:

Sellers start here button1   Buyers start here button1

Reasons to Sell Before Spring!

Source: Keeping Current Matters

Is spring closer than we think? Depending on which Groundhog you witnessed, you may have less time than you think to get your home on the market before the busy spring season.

Many sellers feel that the spring is the best time to place their home on the market as buyer demand traditionally increases at that time of year. However, the next six weeks before spring hits also have their own advantages.

Here are five reasons to sell now.

1. Demand is Strong

Foot traffic refers to the number of people out actually physically looking at homes right now. The latest foot traffic numbers show that there are currently more prospective purchasers looking at homes than at any other time in the last 12 months, which includes last spring’s buyers’ market. These buyers are ready, willing and able to purchase… and are in the market right now!

Take advantage of the buyer activity currently in the market.

2. There Is Less Competition Now

Housing supply just dropped to 4.4 months, which is under the 6 months’ supply that is needed for a normal housing market. This means, in many areas, there are not enough homes for sale to satisfy the number of buyers in that market. This is good news for home prices. However, additional inventory is about to come to market.

There is a pent-up desire for many homeowners to move, as they were unable to sell over the last few years because of a negative equity situation. Homeowners are now seeing a return to positive equity as real estate values have increased over the last two years. Many of these homes will be coming to the market in the near future.

Also, new construction of single-family homes is again beginning to increase. A recent study by Harris Poll revealed that 41% of buyers would prefer to buy a new home while only 21% prefer an existing home (38% had no preference).

The choices buyers have will increase in the spring. Don’t wait until all this other inventory of homes comes to market before you sell.

3. The Process Will Be Quicker

One of the biggest challenges of the housing market has been the length of time it takes from contract to closing. Banks are requiring more and more paperwork before approving a mortgage. There is less overall business done in the winter. Therefore, the process will be less onerous than it will be in the spring. Getting your house sold and closed before the spring delays begin will lend itself to a smoother transaction.

4. There Will Never Be a Better Time to Move-Up

If you are moving up to a larger, more expensive home, consider doing it now. Prices are projected to appreciate by over 23.5% from now to 2019. If you are moving to a higher priced home, it will wind-up costing you more in raw dollars (both in down payment and mortgage payment) if you wait. You can also lock-in your 30-year housing expense with an interest rate below 4% right now. Rates are projected to be a full point higher by the end of 2015.

5. It’s Time to Move On with Your Life

Look at the reason you decided to sell in the first place and determine whether it is worth waiting. Is money more important than being with family? Is money more important than your health? Is money more important than having the freedom to go on with your life the way you think you should?

Only you know the answers to the questions above. You have the power to take back control of the situation by putting your home on the market. Perhaps, the time has come for you and your family to move on and start living the life you desire.

That is what is truly important.


Are you ready to put Don’s 35 years of business and sales experience to work for you? Simply click on the appropriate red button below:

Sellers start here button1 Buyers start here button1

“Listings Up and Sales Down Means Bigger Inventory”

Source: The official blog of the REALTORS® Association of Edmonton

Residential listings are up almost 30 percent compared to January of last year. 2,316 new listings came on the MLS® System for the Edmonton Census Metropolitan Area (CMA) in January compared to only 932 new listings in December. Sales for January were 666 (not adjusted) – down 13.5 percent month over month and down 25.9 percent from last year. These two factors resulted in a 35 percent inventory growth from 3,059 to 4,132 last month. Inventory is up almost 17 percent from the same time last year.

“We ended 2014 with low inventory. While this is not unusual for the winter, it can make it difficult for buyers to find the right home. The influx of properties we have seen on the market in January will be a relief for buyers – allowing them more choice in their price range and possibly more time to make their selection.” REALTORS® Association of Edmonton President Geneva Tetreault explains, “Buyers in the popular $400,000 price range often struggled in 2014 to find their ideal property or had to move quickly before it sold. This increase in inventory will be a great benefit to them.”

Prices still remain strong in the Edmonton CMA market. The all residential price went up almost 1 percent from last month to $362,394 (up 3.75 percent from January 2014). Single family houses averaged $427,178 down half a percent from December, but up over 3 percent from the previous year. Condo prices stayed stable at $247,116 – up 5.5 percent from January 2014. We are continuing to see last year’s trend of high priced properties elevating the average prices. Last month, nine of the 666 properties sold for over $900,000.

The average days-on-market last month was 58, up from 55 in December and down from 60 in January 2014.

“We are likely seeing the effects of oil prices and a feeling of economic cautiousness amongst some buyers. Clients are looking to REALTORS® for advice and guidance to navigate their own individual situations. We expect more of an uptake in the market as spring approaches and more people start to look for homes.” Tetreault revealed. “Low interest rates will continue to drive the housing market.”

-30-

1 Census Metropolitan Area (Edmonton and surrounding municipalities)
2 Single Family Dwelling
3 The total value of sales in a category divided by the number of properties sold
4 The middle figure in a list of all sales prices
5 Residential includes SFD, condos and duplex/row houses.
6 Includes residential, rural and commercial sales

3 Average prices indicate market trends only. They do not reflect actual changes for a particular property, which may vary from house to house and area to area. Prior period sales figures have been adjusted to include late reported sales and cancellations and therefore reflect a more accurate view of the period than previously reported at month end. The RAE trading area includes communities beyond the CMA (Census Metropolitan Area) and therefore average and median prices may include sold properties outside the CMA.”


Are you ready to put Don’s 35 years of business and sales experience to work for you? Simply click on the appropriate red button below:

Sellers start here button1 Buyers start here button1

Woodlands St. Albert Real Estate Statistics – January 2015

Woodlands St. Albert Real Estate Statistics – January 2015

Click here for all Woodlands homes for sale in St. Albert. A total of 2 homes were sold in Woodlands in January. On average, it takes 30 days to sell a Woodlands home. The average list price for a Woodlands home in January was $429,450, and the average sold price was $440, 500. The highest year-to-date sold price of a Woodlands home was $461,000. There are currently 2 homes and 1 condominium for sale in Woodlands.

Ready to buy in Woodlands? – CLICK HERE!!! 

Ready to sell in Woodlands? – CLICK HERE!!!

Woodlands St. Albert Real Estate Statistics

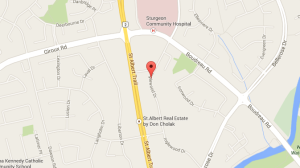
Sturgeon Heights St. Albert Real Estate Statistics – January 2015

Sturgeon Heights St. Albert Real Estate Statistics – January 2015

Click here for all Sturgeon Heights homes for sale in St. Albert. There were no homes sold in Sturgeon Heights in January. There are currently 5 homes for sale in Sturgeon Heights.

Ready to buy in Sturgeon Heights? – CLICK HERE!!!

Ready to sell in Sturgeon Heights? – CLICK HERE!!!

Sturgeon Heights St. Albert Homes For Sale

Pineview St. Albert Real Estate Statistics – January 2015

Pineview St. Albert Real Estate Statistics – January 2015

Click here for all Pineview homes for sale in St. Albert. There are currently 4 homes for sale in Pineview. A total of 2 homes were sold in Pineview in January. On average, it takes 46 days to sell a Pineview home. The highest year-to-date sold price for a Pineview home is $514,000. The average list price of a Pineview home in January was $476,950, and the average sold price was $470,750.

Ready to buy a home in Pineview? – CLICK HERE!!!

Ready to sell a home in Pineview? – CLICK HERE!!!

Pineview St. Albert Homes For Sale

Oakmont St. Albert Real Estate Statistics – January 2015

Oakmont St. Albert Real Estate Statistics – January 2015

Click here for all Oakmont homes for sale in St. Albert. On average, it takes 36 days to sell an Oakmont home. A total of 3 Oakmont homes were sold in January. The average list price of an Oakmont home in January was $483,267, and the average sold price was $477,167. The highest year-to-date sold price of an Oakmont home was $547,500. There are currently 10 homes for sale in Oakmont.

Ready to buy in Oakmont? – CLICK HERE!!!

Ready to sell in Oakmont? – CLICK HERE!!!

Oakmont St. Albert Homes For Sale

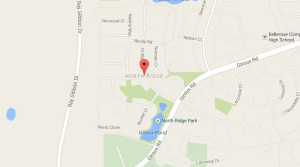
North Ridge St. Albert Real Estate Statistics – January 2015

North Ridge St. Albert Real Estate Statistics – January 2015

Click here for all North Ridge homes for sale in St. Albert. A total of 3 homes were sold in North Ridge in January. On average, it takes 34 days to sell a North Ridge home. The highest year-to-date sold price of a North Ridge home was $685,000. The average list price of a North Ridge home for January was $544,600, and the average sold price was $530,67. There are currently 21 homes and 2 condominiums for sale in North Ridge.

Ready to buy in North Ridge? – CLICK HERE!!!

Ready to sell in North Ridge? – CLICK HERE!!!

North Ridge St. Albert Homes For Sale

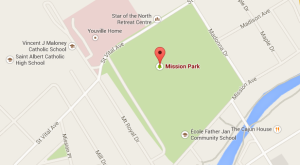
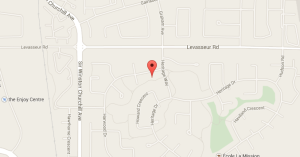
Mission Park St. Albert Real Estate Statistics – January 2015

Mission Park St. Albert Real Estate Statistics – January 2015

Click here for all Mission Park homes for sale in St. Albert. No homes were sold in Mission Park in January. There are currently 5 homes and 3 condominiums for sale in Mission Park.

Ready to buy in Mission Park? – CLICK HERE!!!

Ready to sell in Mission Park? – CLICK HERE!!!

Mission Park St. Albert Homes For Sale

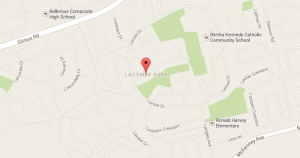
Lacombe Park St. Albert Real Estate Statistics – January 2015

Lacombe Park St. Albert Real Estate Statistics – January 2015

Click here for all Lacombe Park homes for sale in St. Albert. There are currently 15 homes and 7 condominiums for sale in Lacombe Park. A total of 5 homes were sold in Lacombe Park in January. On average, it takes 18 days to sell a Lacombe Park home. In January, the average list price of a Lacombe Park home was $404,925, and the average sold price was $396,125. The highest year-to-date sold price of a Lacombe Park home was $766,500.

Ready to buy in Lacombe Park? – CLICK HERE!!!

Ready to sell in Lacombe Park? – CLICK HERE!!!

Lacombe Park St. Albert Homes For Sale

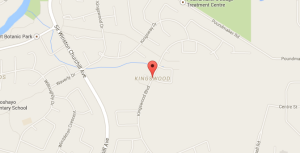
Kingswood St. Albert Real Estate Statistics – January 2015

Kingswood St. Albert Real Estate Statistics – January 2015

Click here for all Kingswood homes for sale in St. Albert. There was 1 home sold in Kingswood in the month of January. The highest year-to-date sold price of a Kingswood home was $766,500. On average, it takes 92 days to sell a home in Kingswood. The average list price of a Kingswood home in January was $799,900, and the average sold price was $766,500. There are currently 18 homes for sale in Kingswood.

Ready to buy in Kingswood? – CLICK HERE!!!

Ready to sell in Kingswood? – CLICK HERE!!!

Kingswood St. Albert Homes For Sale

Inglewood Park St. Albert Real Estate Statistics – January 2015

Inglewood Park St. Albert Real Estate Statistics – January 2015

Click here for all Inglewood Park homes for sale in St. Albert. There were no homes sold in Inglewood Park in January. There are currently 4 condominiums for sale in Inglewood Park.

Ready to buy in Inglewood Park? – CLICK HERE!!!

Ready to sell in Inglewood Park? – CLICK HERE!!!

Inglewood Park St. Albert Homes For Sale

Heritage Lakes St. Albert Real Estate Statistics – January 2015

Heritage Lakes St. Albert Real Estate Statistics – January 2015

Click here for all Heritage Lakes homes for sale in St. Albert. A total of 3 Heritage Lakes homes were sold in January. On average, it takes 47 days for a Heritage Lakes home to sell. The highest year-to-date sold price of a Heritage Lakes home is $620,000. The average list price of a Heritage Lakes home in January was $501,500, and the average sold price was $484,333. There are currently 10 homes and 1 condominium for sale in Heritage Lakes.

Ready to buy in Heritage Lakes? – CLICK HERE!!!

Ready to sell in Heritage Lakes? – CLICK HERE!!!

Heritage Lakes St. Albert Homes For Sale

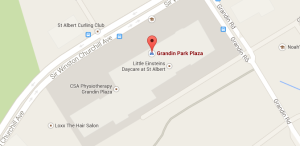
Grandin St. Albert Real Estate Statistics – January 2015

Grandin St. Albert Real Estate Statistics – January 2015

Click here for all Grandin homes for sale in St. Albert. The average list price of a Grandin home in January was $340,600, and the average sold price was $341,150. On average, it takes 33 days to sell a Grandin home. There are currently 15 homes and 11 condominiums for sale in Grandin. There were a total of 4 homes sold in Grandin in January. The highest year-to-date selling price of a Grandin home is $438,000.

Ready to buy in Grandin? – CLICK HERE!!!

Ready to sell in Grandin? – CLICK HERE!!!

Grandin St. Albert Real Estate Statistics