RE/MAX Commercial Investor Report 2015

EDMONTON

In the first half of 2015, the commercial property market in Edmonton felt the impact of the drop in oil prices. The number of commercial building and land sales was down 9 per cent and the overall value of those sales was down 13 per cent year-over-year. For the first time in three years, total sales at mid-year dipped below $1 billion.

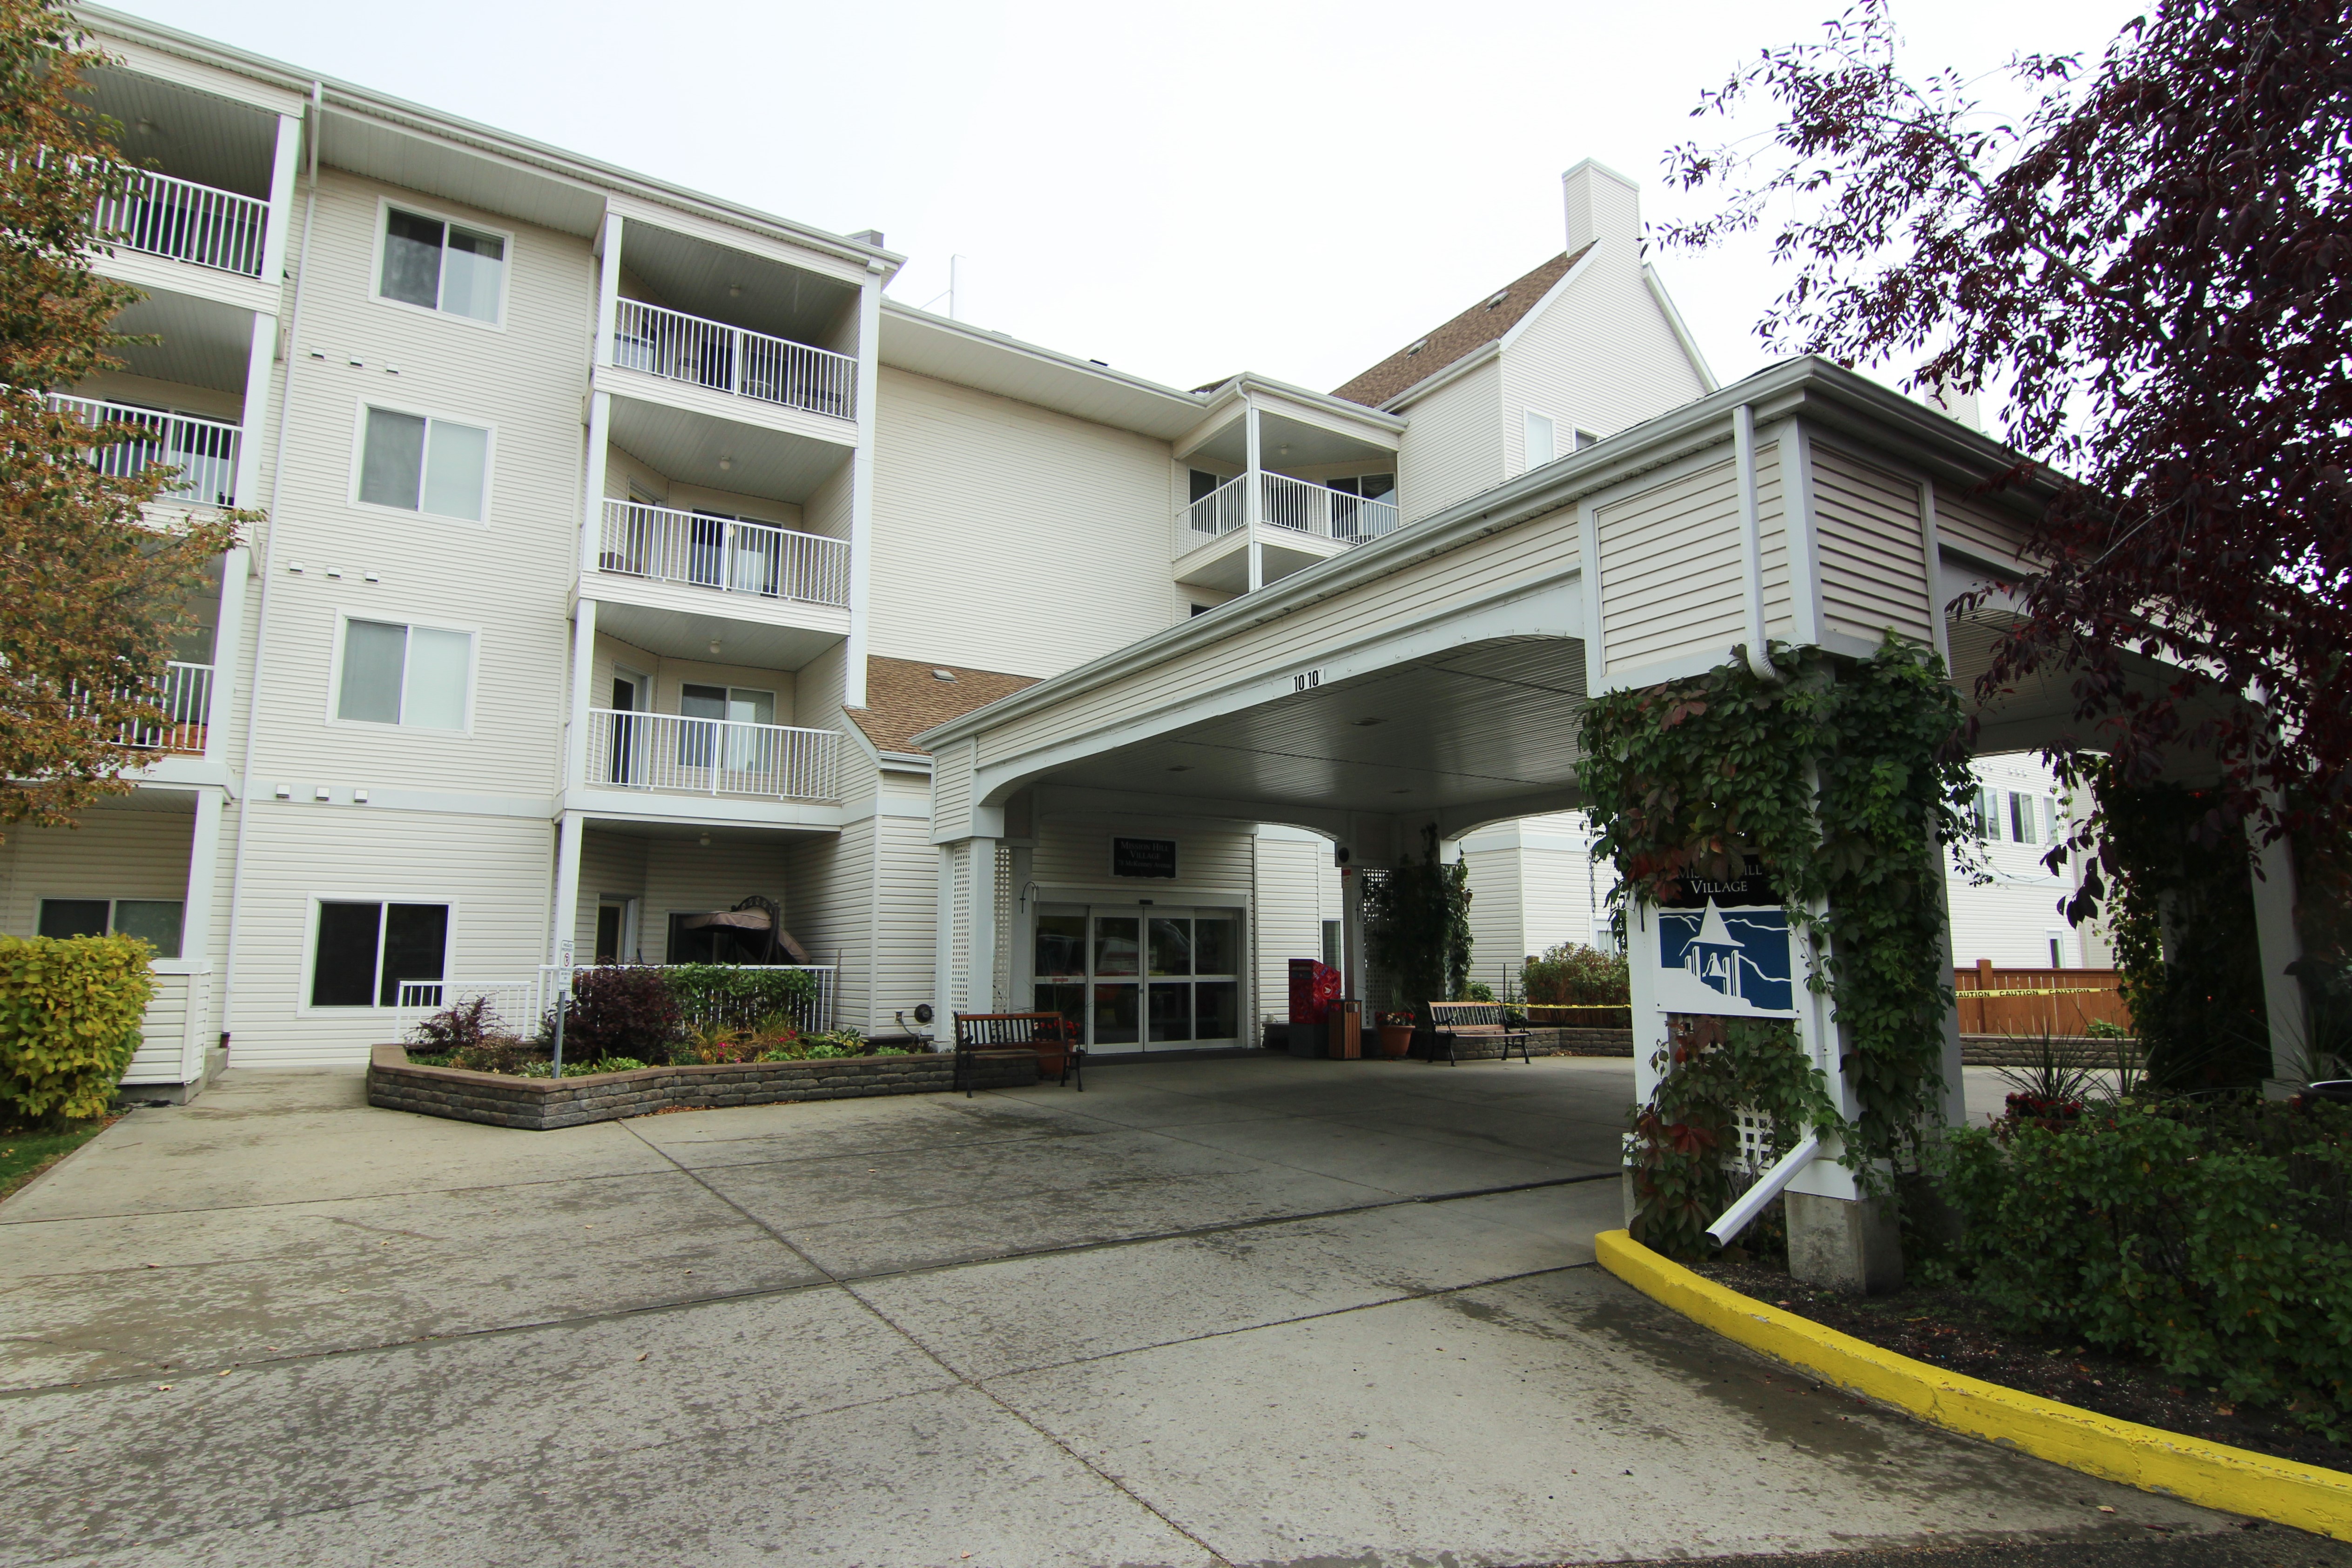
The most significant decline was in land sales; sales decreased by 30 per cent year-over-year, indicative of a slowing economy. A bright spot was multi-family residential – sales increased by 45 per cent year-over-year, driven by continued low vacancy and high rental rates in the city. Overall, sales in the third quarter are pointing toward continued slower activity through to the end of the year.

There is a good representation of Real Estate Investment Trusts (REITs) and pension funds; however, the regional/local private companies are currently driving demand in Edmonton’s commercial property market. The industrial market has slowed, due to downsizing in the oil service sector driven by decline in oil prices. There is increasing demand from foreign buyers for good quality assets. U.S. investors in particular are taking advantage of the opportunities afforded by the lower Canadian dollar.

Top tier assets in all sectors continue to be in high demand. Multi-family residential, well-positioned retail and industrial properties with well-capitalized tenants are the most in-demand property types. There is a shortage of good-quality products in these categories and they are quick to sell when they come on the market.

Vacancy rates in the city were healthy at mid-year; the vacancy rate in industrial was at 5 per cent, and retain and multi-family at 2.5 per cent. Office vacancy rates are at 8.5 per cent and expected to rise in the coming year as new supply comes on the market. 1.2 million square feet of new office inventory, plus over 3.0 million square feet of new industrial supply and sublease space are anticipated to come on the market by the end of 2016. With oil companies downsizing to reduce costs, owners may be competing to attract and retain office and industrial tenants, which could cause hesitation among investors in these segments. Conversely, opportunities may arise for assets that will need to be repositioned.

Recent developments that may slow down Edmonton’s commercial property market in the coming year include the NDP goverment’s provincial oil and gas royalty review, further capital spending cutback announcements by the oil producers, increases in provincial personal and corporate taxes and the minimum wage increase to $15 per hour. In June 2015, Alberta’s provincial government forecast in its first quarter fiscal update a disconcerting $5.9 to $6.5 billion annual deficit for the year ending March 31, 2016.

Despite economic slowdown due to the downturn in the oil industry, ongoing development projects are boosting the city’s outlook. In downtown Edmonton, the 25-acre, $2 billion Ice District development features a new arena, public plaza, office and condo towers, entertainment venues, hotels and retail. A new provincial museum, new LRT station and expansions to the campuses of MacEwan University and NorQuest College are in progress as well. The completion of the Anthony Henday ring road, scheduled for 2016, is expected to unlock suburban development opportunities in northeast Edmonton.

Until oil rebounds, Edmonton is expected to remain in a down cycle. However, significant ongoing development in the city is prompting optimism, and with an experienced commercial group of owners, the market is expected to adjust and move forward.
 

#211, 78 McKenney Avenue : St. Albert : E3433740

Welcome to this 1 bedroom, 1.5 bathroom, 925sq.ft condo in Mission!


MLS#: E3433740 1 bedroom + 1.5 bathroom condo in the incredible 50+ active living community of Mission Hill Village! Large, spacious, and bright unit. Enjoy countless opportunities from the building’s many amenities, including hair salon, wood workshop, craft room, library, and more!
 
Listing-Details-Button

Fall Home Maintenance

The days are getting shorter, and maybe there’s a nip in the air – autumn is here at last. Now is the perfect time to get your home in shape before winter starts to take its toll, and while the weather is still pleasant enough to spend time outdoors.

Seal it up: Caulk and seal around exterior door and window frames. Look for gaps where pipes or wiring enter the home and caulk those as well. Not only does heat escape from these openings, but water can enter and may eventually cause structural damage and mold problems.

Look up: Check the roof for missing or damaged shingles. Upcoming winter weather can cause serious damage to a vulnerable roof, leading to a greater chance of further damage inside the home. It’s best to have a qualified professional inspect and repair the roof, but you can do a preliminary survey from the ground using binoculars.

Clear it out: Clear gutters and eaves troughs of leaves, sticks, and other debris. Consider installing leaf guards if your gutters can accommodate them – they are real time savers and can prevent damage from clogged gutters. Check the joints between sections of gutter, as well as between the gutter and downspouts, and make any necessary adjustments to tighten them.

No hose: In climates with freezing weather, drain garden hoses and store indoors to protect them from the elements. Shut off outdoor faucets and make sure exterior pipes are drained of water. Faucets and pipes can easily freeze and burst, causing leaks and water damage.

Warm up time: Have the furnace inspected to ensure it’s safe and in good working order. Most utility companies will provide no-cost inspections, but there can often be a long waiting list come fall and winter. Replace disposable furnace air filters or clean the permanent type according to the manufacturer’s instructions. Using a clean filter will help the furnace run more efficiently, saving you money and energy.

Light that fire: If you enjoy the crackle of the fireplace on a chilly fall evening, have the firebox and chimney cleaned before using it this season. Creosote, a byproduct of wood burning, can build up to dangerous levels and cause a serious chimney fire if not removed.

Source: Pillar to Post e-Newsletter
 

Travel up 9.7% in August 2015

Source: dr1 Travel News

Non-resident air arrivals to the Dominican Republic are now up 7.9% from January to August 2015, which promises to be a bumper year for tourism in the Dominican Republic.
After a record 10.4% in arrivals in July, August turned in another strong month with 9.7%, according to statistics compiled by the Central Bank.
In August 2015, 465,806 non-resident air arrivals were up 41,091 compared to the same month in 2014. The number of non-resident foreign tourists was 396,091, up 8.9%, equal to 32,445 more tourists. The number of Dominican non-resident arrivals was 69,175, up 14.2%, or 8,646 more visitors this August compared to last year.
Most tourists continue to come from the United States and Canada. From January to August 2015, non-resident visitors totaled 3,892,892 passengers, 87.2% of whom were foreigners and 12.8% non-resident Dominicans.
The Central Bank also notes significant growth in the South American market from January to August 2015 compared to last year with increases in tourists coming from Brazil (24,377), Venezuela (15,329), Argentina (12,343), Colombia (7,582), Chile (3,945) and Peru (3,177).
More tourists arrived from Europe, with the exception of Russia. Spain was up 14,816, UK 12,770, Germany 9,584, Portugal 5,137, Italy 4,381, the Netherlands 2,477, Poland 1,982 and France 1,651. But there was a marked decline of 80,459 visitors from Russia, reflecting the economic crisis affecting the country.
Central Bank analysts concluded that the increase in visitors was due to the improvements in the US economy and strategies implemented by the Ministry of Tourism working closely with the private sector to consolidate the DR’s leading position in tourism in the Caribbean.
From January to August 2015, resident and non-resident arrivals totaled 4,254,119.
Most tourists arrived via Punta Cana International Airport with 66.6% of total foreigner air arrivals, for 2,261,546 arrivals from January to August 2015, up 8.5% compared to the same period last year.

Commercial/Industrial real estate market takes a dip

Source: EREB

The REALTORS® Association of Edmonton Commercial Division released the semi-annual update on commercial real estate activity within the City of Edmonton. The report includes a synopsis of commercial and industrial activity for the period ending June 30, 2015 as recorded in Land Titles records when the title to the property is transferred to the buyer.

The total number of sales (284) of commercial and industrial land and buildings in Edmonton for the first half of 2015 is down 9.27% when compared to the same period last year. For the first time in three years, the value of those sales has dipped below one billion dollars at mid-year. The 2015 total value was $911 million, 13.43% lower than mid-year 2014.

“With the drop in oil prices throughout the end of 2014 and beginning of 2015, we anticipated that commercial growth within the City of Edmonton would cool down.” said Michael Thompson, President and CEO of the REALTORS® Association of Edmonton. “While sales dropped in most areas, we continue to see growth in multi-family buildings and commercial land, most of which can be attributed to the strength within the suburban markets.”

While multi-family building transactions remained stable at 33, overall sales volumes jumped 45% to $271 million, compared to $187 million and $188 million for mid-year 2014 and 2013 respectively. This surge in commercial multi-family sales comes while housing starts in the market remained very strong during the first half of 2015 and single family residential values held steady.

At $131 million, the value of urban development land sales dropped 47.3% compared to the same time last year. The total value of all land sub-sectors (industrial, commercial, multi-family, urban development and institutional) was $310 million, down more than $134 million compared to mid-year 2014. The only subsectors to see an increase in values compared to mid-year 2014 were commercial condos, commercial land, and multi-family buildings, which combined recorded sales of $361 million, an increase of 43.5%.


Are you ready to put Don’s 35 years of business and sales experience to work for you? Simply click on the appropriate red button below:

Sellers start here button1 Buyers start here button1

Boom year for Dominican tourism

Source: dr1 Travel News

Central Bank Governor Hector Valdez Albizu says that July 2015 was a record month for non-resident travel to the Dominican Republic. A record 568,323 visitors, including foreigners and non-resident Dominicans (10.4% annual growth) arrived in the country in July 2015. Travel in August 2015 is also showing a strong increase of 9.7%. Based on the strong summer month figures, Valdez is forecasting a record year for Dominican tourism. It is also worth mentioning that tourism will receive an additional boost later this year with the maritime arrivals via the Carnival Amber Cove port in Puerto Plata, scheduled to open on 6 October 2015.

Amber Cove nearly ready to open

Source: dr1 Travel News

The new Carnival Corporation cruise port in Maimon, Puerto Plata province in the north of the Dominican Republic is expecting its first ship on 6 October, 2015. The port is a US$85 million investment on a site that is about 15 minutes from the city of Puerto Plata. The pier has the capacity for docking two of Carnival’s largest ships at once. A parking area and transportation hub has been included for buses and taxies, and there is a large area for bars, restaurants and shops.
An estimated 350,000 cruise ship passengers are expected to arrive in Amber Cove in its first year. Carnival ships that will be making stops at Amber Cove in its first year include:
Carnival Victoria (Miami, Grand Turk, Amber Cove)
Carnival Splendor (Miami, Amber Cove, St. Thomas, San Juan, Grand Turk)
Carnival Valor (Orlando, Amber Cove, St. Thomas, San Juan, Grand Turk)
Carnival Glory (Miami, Amber Cove, St. Thomas, San Juan, Grand Turk)
Carnival Sunshine (Orlando, Amber Cove, St. Thomas, San Juan, Grand Turk)
Carnival Breeze (Miami, St. Maarten, Antigua, St. Thomas, Amber Cove)
Carnival Conquest (Fort Lauderdale, Grand Turk, Amber Cove, Half Moon Cay)
Costa Deliziosa (Fort Lauderdale, Nassau, Amber Cove, Ocho Rios, Grand Cayman, Roatan, Cozumel)
Queen Mary II on a 13, 20 and 28-night Caribbean cruise departing from Manhattan.
Queen Mary II on its 23, 38, 53, 60, 62, 78, 87, 98 and 120-night world cruises
Eurodam (Fort Lauderdale, Half Moon Cay, Falmouth, Grand Cayman, Key West)
Excursions include a city tour of Puerto Plata, Cabarete beach, Ocean World, Paradise island, Punta Rucia, Catamaran tours, La Isabela first European settlement site, Lifestyle Resort visit, scuba diving, Outback Safari, Santiago city tour and deep sea fishing.

A new cruise destination takes shape in Dominican Republic

Source: USA Today

PUERTO PLATA, Dominican Republic — Cruise fans are just weeks away from having somewhere new to go in the Caribbean.

Amber Cove, a new port development along the north coast of the Dominican Republic, is well on track to open as scheduled next month for the first of what is expected to be more than 100 cruise calls a year.

Under development by cruise giant Carnival Corp. at a cost of $85 million, the 25-acre complex near the town of Puerto Plata is being billed as one of the biggest Caribbean port projects of the past decade and will feature a large area of bars, restaurants and shops — all of which appeared near completion this week during a sneak peek for cruise writers.

Amber Cove also will have a sprawling pool area with a swim-up bar, water slides, zip lines and private cabanas that also are quickly coming together.

Still, the complex’s main role will be as a gateway to the region’s many historic sites, beaches and adventure activities. Nearly half of the site’s acreage is devoted to a massive transportation hub where cruisers will find taxis and buses to take them to area attractions. More than 40 organized shore excursions will be available from the port, and Carnival executives say they expect an unusually high percentage of cruisers to sign up for the outings.

“Amber Cove, the port, is not the destination,” David Candib, the Carnival Corp. manager for the project, stressed during the tour. “The region of Puerto Plata really is what the cruise port is about.”

Long a tourist destination with resorts and timeshare developments, the area around Puerto Plata offers a wide array of attractions including beaches, golf courses, and wild areas that can be explored by horseback and ATV. It’s also home to one of the first Spanish forts in the Americas; one of the best-known rum distilleries in the Dominican Republic; a marine adventure park where visitors can swim with dolphins and sharks; and a museum dedicated to amber, which is mined in the region (hence the name Amber Cove).

The government of the Dominican Republic has been working with Carnival Corp. to prepare for an expected cruise boom to the region over the coming year. In a private tour of improvements under way around Puerto Plata’s historic district, the country’s vice minister of tourism, Julio Almonte, showed USA TODAY upgrades in the works to a waterfront area that connects the historic Fortaleza San Felipe to the town’s central square. The government also is widening the road from Amber Cove to Puerto Plata to make transportation to the historic district more efficient.

Almonte said locals are excited about the arrival of ships full of thousands of vacationers. “We’ve waited almost 30 years for a project like this,” Almonte said. “The future of Puerto Plata is … with Amber Cove.”

The north coast of the Dominican Republic hasn’t seen cruise ships since the 1980s, when the typical passenger vessel was much smaller than today. The main port for the region, in Puerto Plata, isn’t big enough to accommodate today’s larger vessels.

Located on a mountain-ringed bay about six miles from Puerto Plata, Amber Cove features a 1,280-foot pier with a channel dredged to 36 feet that is capable of handling two of the largest ships in the Carnival Corp. fleet at once. Candib told USA TODAY it even could handle vessels as large as those in Royal Caribbean’s Oasis class — the world’s biggest cruise ships.

Amber Cove is expected to draw 350,000 cruisers in its first year in operation from such Carnival Corp. brands as Carnival, Holland America, Princess and Costa. It’ll also be the destination for bi-weekly “social impact” cruises to the Dominican Republic from Miami planned by Carnival Corp.’s new fathom brand. The trips start in April.

The first ship to arrive at Amber Cove, on Oct. 6, will be the 2,754-passenger Carnival Victory.

Located just 679 miles southeast of Miami, Amber Cove will fit into a wide range of Caribbean itineraries, including shorter-than-seven-night sailings from Florida, Candib said. It’s just 100 miles from Carnival Corp.’s port on Grand Turk and 276 miles from San Juan, Puerto Rico.

Among already-announced itineraries that include the port are seven-night Carnival sailings from Miami to the Eastern Caribbean that also include stops in San Juan, St. Thomas and either Grand Turk or Half Moon Cay, a private island in the Bahamas.

Carnival also is selling an eight-night Eastern Caribbean itinerary from Miami that features calls at Amber Cove as well as St. Maarten, Antigua and St. Thomas. Another eight-night Carnival itinerary from Miami to the Southern Caribbean adds Amber Cove to stops in Santo Domingo, Dominican Republic; Curacao; and Aruba.

Woodlands St. Albert Real Estate Statistics – August 2015

Click here for all Woodlands homes for sale in St. Albert. On average, it takes 23 days to sell a Woodlands home. The highest year-to-date sold price of a Woodlands home is $727,000. A total of 3 homes were sold in Woodlands in the month of August. The average list price of a Woodlands home in August was $321,600, and the average sold price was $313,750. Currently, there are 10 houses and 4 condominiums for sale in Woodlands.

Ready to buy in Woodlands? – CLICK HERE!!!

Ready to sell in Woodlands? – CLICK HERE!!!

Sturgeon St. Albert Real Estate Statistics – August 2015

Click here for all Sturgeon homes for sale in St. Albert. The highest year-to-date sold price of a Sturgeon home is $435,000. No homes were sold in Sturgeon in the month of August. Currently, there are 6 houses for sale in Sturgeon.

Ready to buy in Sturgeon? – CLICK HERE!!!

Ready to sell in Sturgeon? – CLICK HERE!!!

Pineview St. Albert Real Estate Statistics – August 2015

Click here for all Pineview homes for sale in St. Albert. The average list price of a Pineview home in August was $514,900, and the average sold price was $510,000. On average, it takes 69 days to sell a Pineview home. The highest year-to-date sold price of a Pineview home is $749,900. A total of 2 homes were sold in Pineview in the month of August. Currently, there are 5 houses and 2 condominiums for sale in Pineview.

Ready to buy in Pineview? – CLICK HERE!!!

Ready to sell in Pineview? – CLICK HERE!!!

Oakmont St. Albert Real Estate Statistics – August 2015

Click here for all Oakmont homes for sale in St. Albert. Currently, there are 23 houses and 3 condominiums for sale in Oakmont. A total of 4 homes were sold in Oakmont in August. On average, it takes 69 days to sell an Oakmont home. The average list price of an Oakmont home in August was $654,700, and the average sold price was $607,525. The highest year-to-date sold price of an Oakmont home is $1,040,000.

Ready to buy in Oakmont? – CLICK HERE!!!

Ready to sell in Oakmont? – CLICK HERE!!!

North Ridge St. Albert Real Estate Statistics – August 2015

Click here for all North Ridge homes for sale in St. Albert. The highest year-to-date sold price of a North Ridge home is $818,000. A total of 9 homes sold in North Ridge in the month of August. On average, it takes 31 days to sell a North Ridge home. There are currently 28 houses and 2 condominiums for sale in North Ridge. The average list price of a North Ridge home in August was $413,650, and the average sold price was $408,750.

Ready to buy in North Ridge? – CLICK HERE!!!

Ready to sell in North Ridge? – CLICK HERE!!!

Mission St. Albert Real Estate Statistics – August 2015

Click here for all Mission homes for sale in St. Albert. Currently, there are 7 houses and 8 condominiums for sale in St. Albert. There was 1 home sold in Mission in the month of August. On average, it takes 20 days to sell a Mission home. The average list price of a Mission home in August was $349,000, and the average sold price was $345,000. The highest year-to-date sold price of a Mission home is $410,000.

Ready to buy in Mission? – CLICK HERE!!!

Ready to sell in Mission? – CLICK HERE!!!

Lacombe Park St. Albert Real Estate Statistics – August 2015

Click here for all Lacombe Park homes for sale in St. Albert. The highest year-to-date sold price of a Lacombe Park home is $1,192,943. A total of 9 homes were sold in Lacombe Park in August. On average, it takes 41 days to sell a Lacombe Park home. The average list price of a Lacombe Park home in August was $368,975, and the average sold price was $366,100. Currently, there are 26 houses and 10 condominiums for sale in Lacombe Park.

Ready to buy in Lacombe Park? – CLICK HERE!!!

Ready to sell in Lacombe Park? – CLICK HERE!!!

Kingswood St. Albert Real Estate Statistics – August 2015

Click here for all Kingswood homes for sale in St. Albert. On average, it takes 45 days to sell a Kingswood home. In August, the average list price of a Kingswood home was $716,950, and the average sold price was $677,500. A total of 2 homes were sold in Kingswood in August. The highest year-to-date sold price of a Kingswood home is $785,000. There are currently 21 houses and 1 condominium for sale in Kingswood.

Ready to buy in Kingswood? – CLICK HERE!!!

Ready to sell in Kingswood? – CLICK HERE!!!

Inglewood St. Albert Real Estate Statistics – August 2015

Click here for all Inglewood homes for sale in St. Albert. The highest year-to-date sold price of an Inglewood home is $600,000. 1 home was sold in Inglewood in the month of August. There are currently 4 condominiums and 1 house for sale in Inglewood. On average, it takes 39 days to sell an Inglewood home. The average list price of an Inglewood home in August was $239,900, and the average sold price was $234,000.

Ready to buy in Inglewood? – CLICK HERE!!!

Ready to sell in Inglewood? – CLICK HERE!!!

Heritage Lakes St. Albert Real Estate Statistics – August 2015

Click here for all Heritage Lakes homes for sale in St. Albert.  The average list price of a Heritage Lakes home in August was $412,160, and the average sold price was $403,500. The highest year-to-date sold price of a Heritage Lakes home is $653,000. Currently, there are 16 houses and 3 condominiums for sale in Heritage Lakes. On average, it takes 35 days to sell a Heritage Lakes home. A total of 5 homes were sold in Heritage Lakes in August.

Ready to buy in Heritage Lakes? – CLICK HERE!!!

Ready to sell in Heritage Lakes? – CLICK HERE!!!


Grandin St. Albert Real Estate Statistics – August 2015

Click here for all Grandin homes for sale in St. Albert. On average, it takes 34 days to sell a Grandin home. A total of 13 homes were sold in Grandin the month of August. The highest year-to-date sold price of a Grandin home is $660,000. The average list price of a Grandin home in August was $213,450, and the average sold price was $207,400. Currently, there are 22 houses and 34 condominiums for sale in Grandin.

Ready to buy in Grandin? – CLICK HERE!!!

Ready to sell in Grandin? – CLICK HERE!!!

Forest Lawn St. Albert Real Estate Statistics – August 2015

Click here for all Forest Lawn homes for sale in St. Albert. The average list price of a Forest Lawn home in August was $319,267, and the average sold price was $311,667. On average, it takes 67 days to sell a Forest Lawn home. A total of 3 homes sold in Forest Lawn in August. The highest year-to-date sold price of a Forest Lawn home is $540,000. There are currently 7 houses and 3 condominiums for sale in Forest Lawn.

Read to buy in Forest Lawn? – CLICK HERE!!!

Ready to sell in Forest Lawn? – CLICK HERE!!!