


Source: www.yegishome.ca
By Angie Calder Telepenko
Real estate activity in the whole capital region was high last year, but these neighbourhoods were the top ten in MLS® System sales for single family homes and condominiums.
1. Oliver
At 414 sales in 2014, this was Edmonton’s hottest neighbourhood for MLS® System sales. This area immediately west of the downtown core is made up mostly of condominiums and commercial properties, although you will still find some heritage homes from the days when it was considered the west end.
2. Rutherford
This community came in second, at 315 sales. It is one of the many neighbourhoods that have sprung up in Edmonton’s southwest in the last couple of decades. Rutherford was designed to include an extensive pedestrian network, and is the choice of many young professionals.
3. Downtown
The downtown core was third, at 273 units sold. It is the financial and business heart of the city, but interspersed are a lot residential land uses. It has been the hub of Edmonton since the turn of the last century, although a resident of that time would not recognize very much today. The area has benefited from the downtown revitalization program which began in the 1990s.
4. The Hamptons
265 MLS® System sales were recorded in 2014 in this west end neighbourhood, which began its development in the early years of this century. Although it is on the periphery of the city, it contains shopping and other amenities, as well as access to the Anthony Henday and other transportation corridors, which means residents can quickly journey to work and leisure pursuits elsewhere.
5. Summerside
This south side neighbourhood, which reported 235 units sold last year, is unique in that it contains Edmonton’s first purpose-built man-made lake, which provides swimming and fishing exclusively for the use of residents. This is reflected in the nautical look of many of the homes, reminiscent of Summerside, PEI which gave the community its name.
6. South Terwillegar
There were 219 residential sales here, in this community which reflects a variety of dwelling types, as well as many open spaces and pedestrian linkages. With construction starting in 2003, and excellent access to arterial roads, it is another newer neighbourhood that attracts a lot of young families.
7. Windermere
Seventh on the list with 176 units sold, this area contains a mix of homes ranging from inexpensive condominiums to upscale estate homes overlooking the river valley. It was part of Strathcona County until the city’s annexation in 1982. Though most of the development is recent, a few older homes, legacies from when it was agricultural land, can still be found.
8. Strathcona
This historic neighbourhood, which began development in 1891, was originally a separate town and only became part of the city of Edmonton in 1912. Last year 168 homes were sold there through the MLS® System. Although most dwellings are now apartments, there still are many stately heritage homes which were built by early movers and shakers. The area has its own artsy atmosphere, due to the Whyte Avenue shopping and entertainment district, and its proximity to the University of Alberta.
9. Westmount
157 units were sold last year in Westmount, another mix of heritage homes and walk-up apartments. Extensive infill development has occurred so there are lots of newer homes as well. 124 Street is the chief transportation artery, and has also developed into an arts, restaurant and shopping district.
10. Garneau
Rounding out the top 10 is Strathcona’s next door neighbour Garneau, which reported 149 MLS® System sales in 2014. Many of its residents are brought there by the nearby University of Alberta. Some of the old historic homes have been converted to U of A student housing. The area also attracts professionals who work downtown, which is across the river and easily accessible via the High Level and Walterdale Bridges.
These neigbourhoods are an intriguing mix of old and new, starter and upscale… it will be interesting to see what the next year has in store in Edmonton’s real estate market.
Edmonton’s Top Ten Neighbourhoods
CMHC to Increase Mortgage Insurance Premiums
Source: www.cmhc-schl.gc.ca
As a result of its annual review of its insurance products and capital requirements, CMHC is increasing its homeowner mortgage loan insurance premiums for homebuyers with less than a 10% down payment. Effective June 1, 2015, the mortgage loan insurance premiums for homebuyers with less than a 10% down payment will increase by approximately 15%.
For the average Canadian homebuyer who has less than a 10% down payment, the higher premium will result in an increase of approximately $5 to their monthly mortgage payment. This is not expected to have a material impact on housing markets.
Premiums for homebuyers with a down payment of 10% or more and for CMHC’s portfolio insurance and multi-unit insurance products remain unchanged. The changes do not apply to mortgages currently insured by CMHC.
“CMHC completed a detailed review of its mortgage loan insurance premiums and examined the performance of the various sub-segments of its portfolio,” said Steven Mennill, Senior Vice-President, Insurance. “The premium increase for homebuyers with less than a 10% down payment reflects CMHC’s target capital requirements which were increased in mid-2014.”
CMHC is mandated to operate its mortgage loan insurance business on a commercial basis. The premiums and fees it collects and the investment income it earns cover related claims and other expenses while providing a reasonable rate of return on its capital holding target.
CMHC contributes to the stability of Canada’s housing finance system, including housing markets, by providing qualified Canadians in all parts of the country with access to a range of housing finance options in both good and bad economic times.
Effective June 1st, CMHC Purchase (owner occupied 1 – 4 unit) mortgage loan insurance premiums will be:
| Loan-to-Value Ratio | Standard Premium (Current) | Standard Premium (Effective June 1st, 2015) |
| Up to and including 65% | 0.60% | 0.60% |
| Up to and including 75% | 0.75% | 0.75% |
| Up to and including 80% | 1.25% | 1.25% |
| Up to and including 85% | 1.80% | 1.80% |
| Up to and including 90% | 2.40% | 2.40% |
| Up to and including 95% | 3.15% | 3.60% |
| 90.01% to 95% – Non-Traditional Down Payment | 3.35% | 3.85% |
CMHC reviews its premiums on an annual basis and will announce decisions on premiums following this review.
Canada Mortgage and Housing Corporation (CMHC) has been Canada’s authority on housing for more than 65 years.
Are you ready to put Don’s 35 years of business and sales experience to work for you? Simply click on the appropriate red button below:


2015 First Quarter Edmonton Real Estate Statistics
Source: Edmonton Real Estate Board
Edmonton and Area Average Price Still Up
Despite a decline in all residential sales over those reported in March of 2014, last month saw continued growth of residential prices for the Edmonton Census Metropolitan Area CMA of 3%. The average sales price of a single family home was $438,880 – up 1.5% y/y; condo was $249,841 – up 1.2% y/y; and duplex/rowhouse was $354,022 – up 6.9% y/y.
Sales are down in all categories except duplex/rowhouse which are up over 6%. Single family sales were 876 down 4.5% over last March (917 reported). 416 condos sold last month compared to 474 in March 2014. All residential sales for March were reported as 1,453, down 6.5% from 1,554 reported last year.
“The fact that our prices did not have the dramatic increases seen over the past few years in other cities like Calgary, Toronto and Vancouver means we have not experienced the same overvaluation.” REALTORS® Association of Edmonton President Geneva Tetreault explains, “That is why our prices are not taking the same hit even though our inventory is way up and sales are slightly down. A more accurate valuation should keep our average prices more stable.”
March 2014 had 14 million-dollar plus sales (30 YTD), March 2015 had 8 million dollar plus sales (19 YTD). “Last year we saw a dramatic increase in sales of homes priced over a million. Even though the number of those high price sales are down this year, our average price is up. That is a good sign that we are not seeing our average prices inflated,” says Tetreault. “The big story continues to be the increase in inventory. We ended 2014 with a fairly low inventory. The influx of new listings means that buyers now have the opportunity to be a little more choosey. Having a REALTOR® help you navigate the market is always a wise decision, particularly in a complex market like ours.” Residential listings are up over 31% from last March with 3,152 new listings coming on to the MLS® System in the Edmonton CMA. That left us with an ample inventory of 5,944 properties for sale.
Rural areas seem to be seeing the same trends with total rural sales down 8% from 156 reported in March 2014 to 143 reported this year. Rural listings are also up, but only by 12%, a much smaller margin than the Edmonton CMA. Over 699 million dollars in residential sales through the REALTORS® Association of Edmonton occurred in March 2015.
| March 2015 | M/M % Change | Y/Y % Change | |
| SFD2 average3 selling price – month | $438,880 | 1.88% | 1.48% |
| SFD median4 selling price – month | $412,500 | 3.13% | 3.15% |
| Condominium average selling price | $249,841 | -0.10% | 1.15% |
| Condominium median selling price | $232,000 | -1.69% | 0.87% |
| All-residential5 average selling price | $373,005 | 2.92% | 3.08% |
| All-residential median selling price | $360,000 | 2.86% | 5.42% |
| # residential listings this month | 3,152 | 21.98% | 31.17% |
| # residential sales this month | 1,453 | 56.07% | -6.50% |
| # residential inventory at month end | 5,944 | 18.69% | 34.69% |
| # Total6 MLS® System sales this month | 1,856 | 33.11% | -7.01% |
| $ Value Total residential sales this month | $596 million | 55.85% | -2.44% |
| $ Value of total MLS® System sales – month | $699 million | 57.84% | -2.74% |
| $ Value of total MLS® System sales – YTD | $1.55 billion | 92.90% | -10.70% |
1 Census Metropolitan Area (Edmonton and surrounding municipalities)
2 Single Family Dwelling
3 The total value of sales in a category divided by the number of properties sold
4 The middle figure in a list of all sales prices
5 Residential includes SFD, condos and duplex/row houses.
6 Includes residential, rural and commercial sales
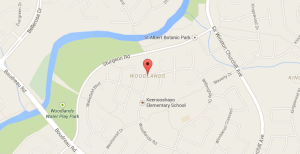
Woodlands St. Albert Real Estate Statistics – March 2015
Woodlands St. Albert Real Estate Statistics – March 2015
Click here for all Woodlands homes for sale in St. Albert. On average, it takes 8 days to sell a Woodlands home. The average list price of a Woodlands home in March was $354,250, and the average sold price was $354,500. There were a total of 2 homes sold in Woodlands in March, and 4 homes sold in Woodlands from January to March. The highest year-to-date sold price of a Woodlands home is $461,000. There are currently 11 homes and 2 condominiums for sale in Woodlands.
Ready to buy in Woodlands? – CLICK HERE!!!
Ready to sell in Woodlands? – CLICK HERE!!!
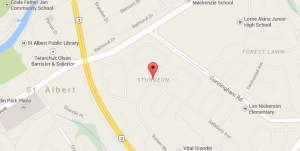
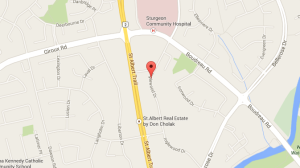
Sturgeon Heights St. Albert Real Estate Statistics – March 2015
Sturgeon Heights St. Albert Real Estate Statistics – March 2015
Click here for all Sturgeon Heights homes for sale in St. Albert. A total of 2 homes were sold in Sturgeon Heights in March, and a total of 4 homes were sold in Sturgeon Heights from January to March. Currently, there are 3 Sturgeon Heights homes for sale. On average, it takes 13 days to sell a Sturgeon Heights home. The average list price of a Sturgeon Heights home in March was $331,450, and the average sold price was $307,750. The highest year-to-date sold price of a Sturgeon Heights home was $395,000.
Ready to buy in Sturgeon Heights? – CLICK HERE!!!
Ready to sell in Sturgeon Heights? – CLICK HERE!!!
Pineview St. Albert Real Estate Statistics – March 2015
Pineview St. Albert Real Estate Statistics – March 2015
Click here for all Pineview homes for sale in St. Albert. There are currently 8 homes for sale in Pineview. A total of 4 homes have sold in Pineview from January to March. The highest year-to-date sold price of a Pineview home is $514,000.
Ready to buy in Pineview? – CLICK HERE!!!
Ready to sell in Pineview? – CLICK HERE!!!
Oakmont St. Albert Real Estate Statistics – March 2015
Oakmont St. Albert Real Estate Statistics – March 2015
Click here for all Oakmont homes for sale in St. Albert. There are currently 26 homes and 1 condominium for sale in Oakmont. From January to March, a total of 15 homes have been sold in Oakmont, and a total of 9 homes were sold in Oakmont in March. On average, it takes 20 days to sell an Oakmont home. The highest year-to-date sold price of an Oakmont home is $806,522. The average list price for an Oakmont home in March was $434,900, and the average sold price was $427,125.
Ready to buy in Oakmont? – CLICK HERE!!!
Ready to sell in Oakmont? – CLICK HERE!!!
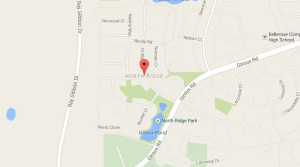
North Ridge St. Albert Real Estate Statistics – March 2015
North Ridge St. Albert Real Estate Statistics – March 2015
Click here for all North Ridge homes for sale in St. Albert. The average list price for a North Ridge home in March was $506,825, and the average sold price was $502,250. The highest year-to-date sold price of a North Ridge home is $715,000. A total of 21 homes were sold in North Ridge from January to March, and a total of 14 homes were sold in North Ridge in March. On average, it takes 39 days to sell a North Ridge home. There are currently 26 homes and 2 condominiums for sale in North Ridge.
Ready to buy in North Ridge? – CLICK HERE!!!
Ready to sell in North Ridge? – CLICK HERE!!!
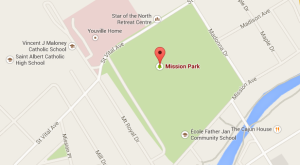
Mission Park St. Albert Real Estate Statistics – March 2015
Mission Park St. Albert Real Estate Statistics – March 2015
Click here for all Mission Park homes for sale in St. Albert. The highest year-to-date sold price of a Mission Park home is $358,000. A total of 5 homes were sold in Mission Park from January to March, and a total of 2 homes were sold in Mission Park in March. On average, it takes 51 days to sell a Mission Park home. The average list price for a Mission Park home in March was $319,000, and the average sold price was $300,000. There are currently 3 homes and 6 condominiums for sale in Mission Park.
Ready to buy in Mission Park? – CLICK HERE!!!
Ready to sell in Mission Park? – CLICK HERE!!!
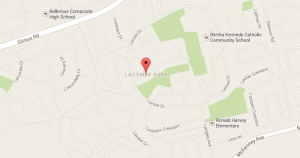
Lacombe Park St. Albert Real Estate Statistics – March 2015
Lacombe Park St. Albert Real Estate Statistics – March 2015
Click here for all Lacombe Park homes for sale in St. Albert. There are currently 21 homes and 7 condominiums for sale in Lacombe Park. On average, it takes 9 days to sell a Lacombe Park home. A total of 8 Lacombe Park homes were sold in March, and 21 homes were sold from January to March. The average list price of a Lacombe Park home in March was $420,075, and the average sold price was $404,750. The highest year-to-date sold price of a Lacombe Park home is $1,040,000. There are currently 21 homes and 7 condominiums for sale in Lacombe Park.
Ready to buy in Lacombe Park? – CLICK HERE!!!
Ready to sell in Lacombe Park? – CLICK HERE!!!
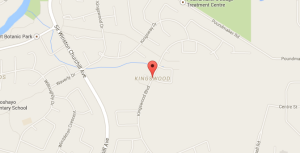
Kingswood St. Albert Real Estate Statistics – March 2015
Kingswood St. Albert Real Estate Statistics – March 2015
Click here for all Kingswood homes for sale in St. Albert. The average list price of a Kingswood home in March was $674,900, and the average sold price was $670,500. On average, it takes 11 days to sell a Kingswood home. A total of 2 homes were sold in Kingswood in the month of March, and 6 homes were sold in Kingswood from January to March. The highest year-to-date sold price of a Kingswood home is $766,500. There are currently 20 homes for sale in Kingswood.
Ready to buy in Kingswood? – CLICK HERE!!!
Ready to sell in Kingswood? – CLICK HERE!!!
Inglewood St. Albert Real Estate Statistics – March 2015
Inglewood St. Albert Real Estate Statistics – March 2015
Click here for all Inglewood homes for sale in St. Albert. There are currently 1 home and 6 condominiums for sale in Inglewood. There were no homes sold in Inglewood from January to March.
Ready to buy in Inglewood? – CLICK HERE!!!
Ready to sell in Inglewood? – CLICK HERE!!!
Heritage Lakes St. Albert Real Estate Statistics – March 2015
Heritage Lakes St. Albert Real Estate Statistics – March 2015
Click here for all Heritage Lakes homes for sale in St. Albert. On average, it takes 27 days to sell a Heritage Lakes home. A total of 4 Heritage Lakes homes were sold in the month of March, and 10 Heritage Lakes homes have been sold from January to March. The highest year-to-date sold price of a Heritage Lakes home is $620,000. The average list price for a Heritage Lakes home in March was $439,900, and the average sold price was $436,100. There are currently 13 homes and 3 condominiums for sale in Heritage Lakes.
Ready to buy in Heritage Lakes? – CLICK HERE!!!
Ready to sell in Heritage Lakes? – CLICK HERE!!!
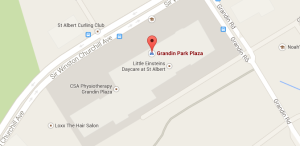
Grandin St. Albert Real Estate Statistics – March 2015
Grandin St. Albert Real Estate Statistics – March 2015
Click here for all Grandin homes for sale in St. Albert. A total of 18 homes were sold in Grandin from January to March. The highest year-to-date sold price of a Grandin home is $660,000. A total of 8 homes were sold in Grandin in the month of March. Currently, there are 20 homes and 24 condominiums for sale in Grandin. The average list price of a Grandin home in March was $441,950, and the average sold price was $435,125. On average, it takes 29 days to sell a Grandin home.
Ready to buy in Grandin? – CLICK HERE!!!
Ready to sell in Grandin? – CLICK HERE!!!
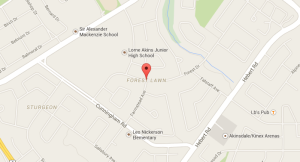
Forest Lawn St. Albert Real Estate Statistics – March 2015
Forest Lawn St. Albert Real Estate Statistics – March 2015
Click here for all Forest Lawn homes for sale in St. Albert. Currently, there are 5 homes and 3 condominiums for sale in Forest Lawn. The average list price of a Forest Lawn home in March was $411,175, and the average sold price was $408,450. On average, it takes 12 days to sell a Forest Lawn home. A total of 4 Forest Lawn homes were sold in March, and 7 Forest Lawn homes have been sold from January to March. The highest year-to-date sold price of a Forest Lawn home is $489,000.
Ready to buy in Forest Lawn? – CLICK HERE!!!
Ready to sell in Forest Lawn? – CLICK HERE!!!
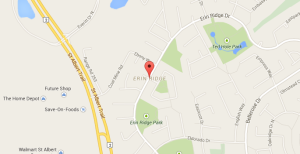
Erin Ridge North St. Albert Real Estate Statistics – March 2015
Erin Ridge North St. Albert Real Estate Statistics – March 2015
Click here for all Erin Ridge North homes for sale in St. Albert. A total of 1 home were sold in Erin Ridge North in March, and a total of 2 homes have been sold in Erin Ridge North from January to March. On average, it takes 10 days to sell an Erin Ridge North home. The average list price for an Erin Ridge North home in March was $569,900, and the average sold price was $590,000. The highest year-to-date sold price of an Erin Ridge North home is $744,000. There are currently 2 homes and 2 condominiums for sale in Erin Ridge North.
Ready to buy in Erin Ridge North? – CLICK HERE!!!
Ready to sell in Erin Ridge North? – CLICK HERE!!!
Erin Ridge St. Albert Real Estate Statistics – March 2015
Erin Ridge St. Albert Real Estate Statistics – March 2015
Click here for all Erin Ridge homes for sale in St. Albert. A total of 20 homes were sold in Erin Ridge from January to March. The highest year-to-date sold price of an Erin Ridge home is $750,000. On average, it takes 35 days to sell an Erin Ridge home. The average list price of an Erin Ridge home in March was $454,100, and the average sold price was $443,375. A total of 12 homes were sold in Erin Ridge in the month of March. Currently, there are 49 homes and 3 condominiums for sale in Erin Ridge.
Ready to buy in Erin Ridge? – CLICK HERE!!!
Ready to sell in Erin Ridge? – CLICK HERE!!!
Deer Ridge St. Albert Real Estate Statistics – March 2015
Deer Ridge St. Albert Real Estate Statistics – March 2015
Click here for all Deer Ridge homes for sale in St. Albert. The average list price for a Deer Ridge home in March was $475,625, and the average sold price was $465,000. A total of 6 homes were sold in Deer Ridge in March. On average, it takes 20 days to sell a Deer Ridge home. A total of 11 homes were sold in Deer Ridge from January to March. The highest year-to-date sold price of a Deer Ridge home is $619,500. There are currently 18 homes and 4 condominiums for sale in Deer Ridge.
Ready to buy in Deer Ridge? – CLICK HERE!!!
Ready to sell in Deer Ridge? – CLICK HERE!!!
Braeside St. Albert Real Estate Statistics – March 2015
Braeside St. Albert Real Estate Statistics – March 2015
Click here for all Braeside homes for sale in St. Albert. The highest year-to-date sold price of a Braeside home is $655,000. A total of 6 homes were sold in Braeside in March. On average, it takes 47 days to sell a Braeside home. The average list price of a Braeside home in March was $468,150, and the average sold price was $452,250. A total of 8 homes were sold in Braeside from January to March. There are currently 7 homes and 4 condominiums for sale in Braeside.
Ready to buy in Braeside? – CLICK HERE!!!
Ready to sell in Braeside? – CLICK HERE!!!
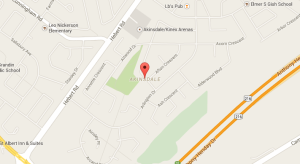
Akinsdale St. Albert Real Estate Statistics – March 2015
Akinsdale St. Albert Real Estate Statistics – March 2015
Click here for all Akinsdale homes for sale in St. Albert. Currently, there are 7 homes and 4 condominiums for sale in Akinsdale. On average, it takes 16 days to sell an Akinsdale home. The average list price of an Akinsdale home in March was $371,275, and the average sold price was $365,750. A total of 5 homes were sold in Akinsdale in March. From January to March, there were a total of 10 homes sold in Akinsdale.
Ready to buy in Akinsdale? – CLICK HERE!!!
Ready to sell in Akinsdale? – CLICK HERE!!!