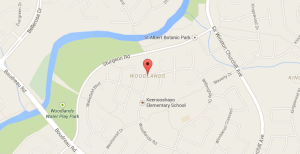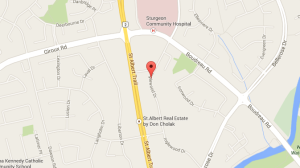


Woodlands St. Albert Real Estate Statistics – February 2015
Click here for all Woodlands homes for sale in St. Albert. There are currently 5 homes and 1 condominium for sale in Woodlands. There were no Woodlands homes sold in February. The highest year-to-date sold price of a Woodlands home is $461,000.
Ready to buy in Woodlands? – CLICK HERE!!!
Ready to sell in Woodlands? – CLICK HERE!!!