


Source: http://www.remonline.com/boomers-or-millennials-who-had-it-tougher-in-the-toronto-housing-market/
The plight of the millennial Toronto home buyer has been a turbulent one; for this generation, the search for the perfect abode has been defined by downsized expectations, sky-high prices and steep competition. While some chalk up millennial financial misfortune to spendthrift lifestyles and expensive taste, the fact is, according to Statistics Canada, two-thirds of Canadians within this age group still live within the family home.
Despite recent market softening, prices for condos, townhomes and houses for sale in Toronto remain exorbitantly expensive, presenting a hurdle to homeownership. According to the latest numbers from the Toronto Real Estate Board, the average home in the 416 fetched an average of $804,642. That’s factoring in a 12.4-per-cent year-over-year drop yet is still outside the realm of affordability for many.
However, long-term market observers can be less than sympathetic. Today’s home buyer enjoys some of the lowest borrowing costs in history, they point out, and earnings that are certainly higher than their ’80s counterparts. Boomers had to contend with interest rates in the high teens, after all, while Generation X faced a recession and dwindling employment prospects.
So, which generation has had the toughest time in Toronto’s housing market? To find out, Zoocasa did the math, assessing how the average home price, wage growth, rate of inflation and debt-servicing costs have changed. Check out how affordability has evolved over the decades in this infographic below.
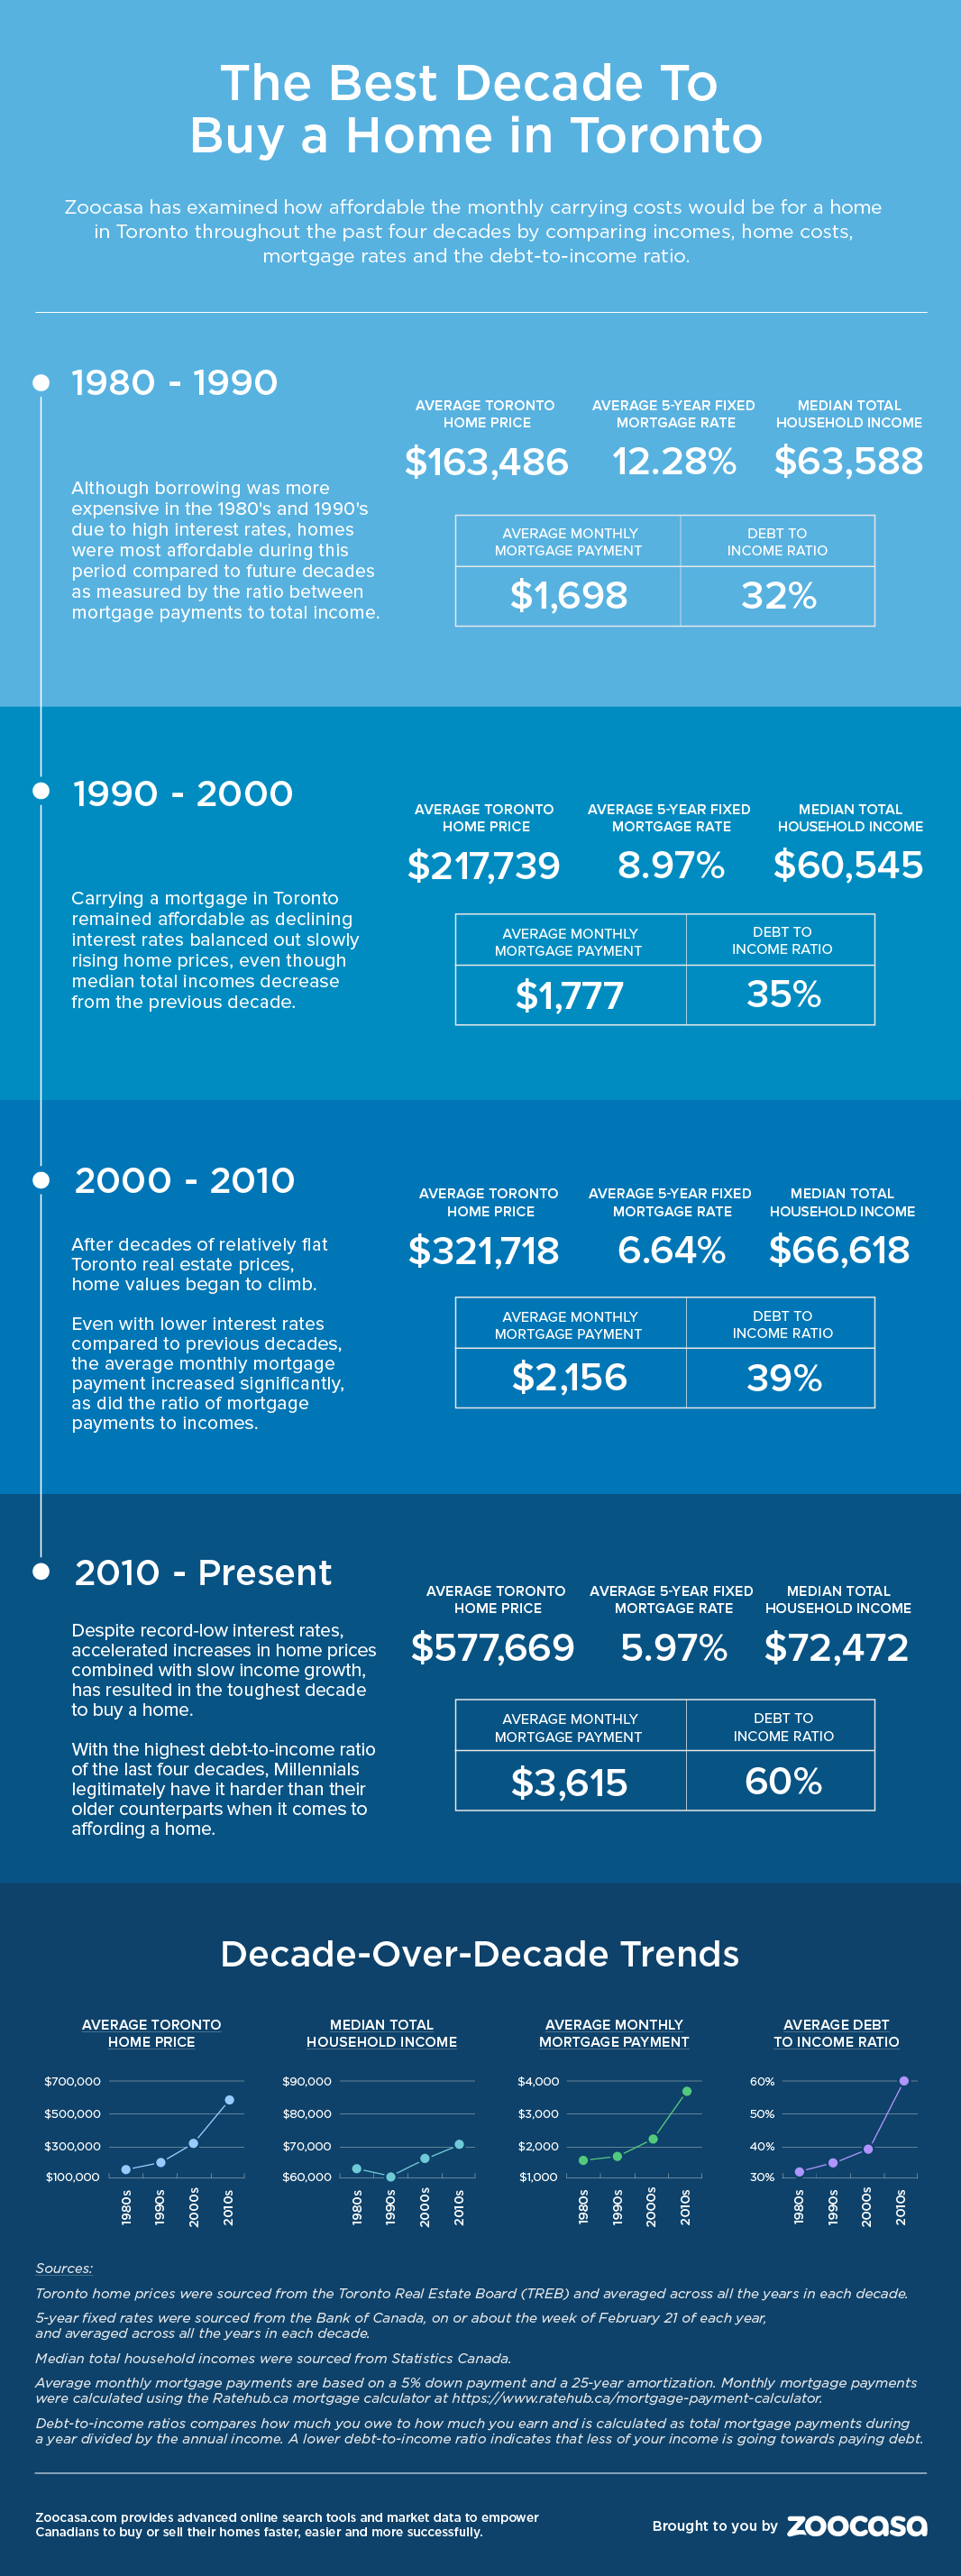
The numbers paint a revealing picture. While the cost of borrowing was indeed in the high teens throughout the ’80s and ’90s, the relationship between median income and average home prices far outstrip any savings resulting from lower mortgage rates.
For starters, there’s the sheer increase in home prices over a 30-year period; in 1980, the average home could be had for $101,626, according to TREB numbers. Factoring in the era’s average mortgage rate of 12.8 per cent, and assuming a five-per-cent down payment and 25-year amortization, the average monthly mortgage payment in 1980 would be $1,698. That rose by a mere $79 (4.6 per cent) over the course of the next decade, with the average carrying cost hitting $1,777 in 1990. By the new millennium, that number had increased by $379 (21.3 per cent) to $2,156, before jumping $1,459 – a whopping 67 per cent – to $3,615 today.
Mortgage carrying costs have also more than doubled that of wage growth over the same period. According to Statistics Canada 2016 Canadian Census numbers, the median household income grew just 33 per cent from the 1980s to the 2010s, from $58,700 to $78,280.
Perhaps most telling is the proportion of debt mortgages now account for in the typical household expenditure. The average debt-to-income ratio, which can be used to determine how much debt is owed in relation to what is earned, has spiked alongside home prices. In 1980, mortgage-specific debt accounted for 32 per cent of this ratio. This increased marginally to 35 per cent in the ’90s, and to 38 per cent in the 2000s. However, following 2010, this ratio shoots up to 59 per cent, a strong indicator that debt loads have bloomed alongside home prices.
To put this in perspective, industry studies find a ratio over 49 per cent signals a struggle to pay down mortgage payments.